Global Cropland Dynamics, 2015–2024
A new Landsat-based annual cropland dataset shows where farmland expanded, where it contracted, and how trade, conflict, drought, and land conversion left different regional signatures.
- Reference
- notes:n09
- Published
- 2026.04.24
- Series
- note
- Source
- Source ↗
Between 2015 and 2024, global cropland area increased by about 6%, from 1.238 to 1.312 billion hectares. Over the same period, the global population grew by roughly 9%, so cropland per person fell by about 3%, from 0.166 to 0.161 hectares.
These estimates come from a new University of Maryland study in Remote Sensing of Environment, Global annual cropland dynamics 2015–2024. Using 30 m Landsat imagery, the authors mapped global cropland annually from 2015 to 2024 and produced a dataset designed for yearly updates.
Data: GLAD Annual Croplands.
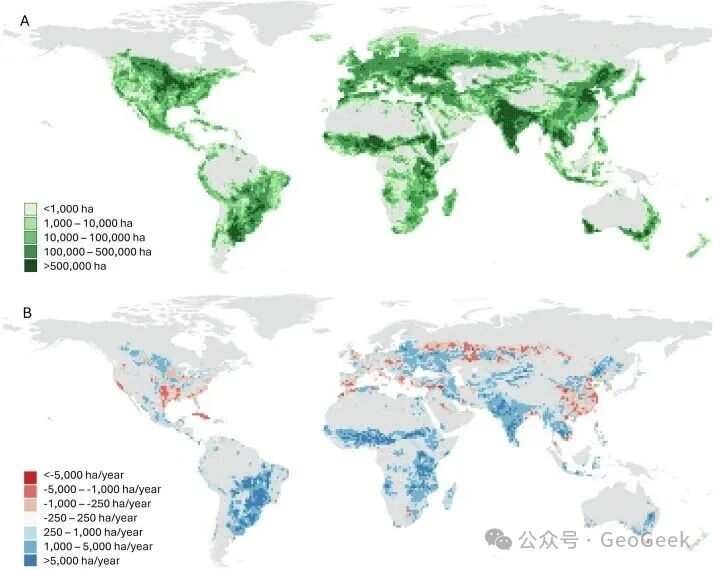
Figure 1 · Cropland extent and change by 1°×1° grid cell. Panel A shows total cropland area in 2024. Panel B shows net cropland-area change over 2003–2024, combining change from the 2003 and 2015 maps of Potapov et al. (2022) with 2015–2024 change derived from the new annual maps.
01 · Where did cropland expand, and where did it contract?
At the continental scale, Africa recorded the largest absolute net increase between 2015 and 2024: 24.5 million hectares, or +12%. South America grew by 19.9 million hectares, a relative increase of 17.4%, the fastest among the major regions. Europe and northern Asia, including Russia, shifted from net cropland loss during 2003–2015 to a net gain of 10.1 million hectares in 2015–2024. By 2024, Southwest Asia, Europe and northern Asia, and Africa together accounted for 57% of global cropland area.
At the country scale, the largest net gains were recorded in Brazil (+16.5 million ha), Russia (+8.0 million ha), India (+5.3 million ha), China (+3.4 million ha), and Tanzania (+3.2 million ha). The largest net losses included Morocco (−0.38 million ha) and Germany (−0.23 million ha). The United Kingdom, France, Denmark, Cuba, and the United States also showed smaller net declines.
The paper notes that Brazil's cropland area has roughly doubled over the past two decades, making it one of the most prominent centers of global agricultural expansion.
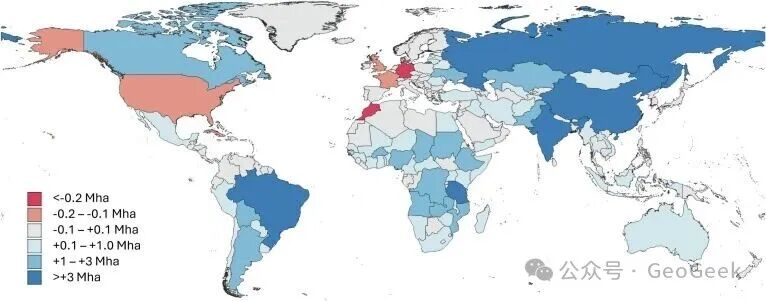
Figure 2 · Net cropland-area change by country, 2015–2024.
02 · What land did new cropland replace?
The authors also classified the sources of new cropland. Based on interpreted samples, 61.5% of new cropland during 2015–2024 came from the recultivation of fallow land or pasture; 27.0% from clearing natural vegetation; 6.3% from irrigation expansion within natural drylands; and 5.2% from replacement of non-forest tree cover.
Combining natural-vegetation clearance and irrigation expansion in natural drylands, about 33.3% of new cropland involved conversion of relatively natural land. This is below the 48% estimated for 2003–2019. The paper suggests one reason: large areas of previously abandoned cropland, particularly in eastern Europe, were brought back into cultivation during the past decade, increasing the share classified as recultivation and reducing the relative share of natural-land conversion.
03 · Where did lost cropland go?
Of cropland that disappeared, 65.4% shifted to fallow land or pasture, 12.9% to agroforestry or tree plantations, 10.2% to built-up land or infrastructure, 1.1% to aquaculture, 2.2% was abandoned because of inundation, and 8.2% returned to natural vegetation.
If built-up land, infrastructure, aquaculture, tree crops, and other intensive uses are grouped together, the authors estimate that about 24.2% of cropland loss shifted into other intensive land uses. Only 8.2% was classified as restoration to natural vegetation, below the 16% estimated for 2003–2019. The authors note that the shorter observation window may make natural recovery on abandoned land harder to identify.
04 · Brazil: expansion in the context of the US–China trade dispute
Brazil had the largest net cropland increase during 2015–2024. The study discusses the acceleration in the context of the US–China trade dispute that began in 2018. After China imposed higher tariffs on US agricultural products, demand for Brazilian soybeans increased and Brazilian soybean prices rose. Fuchs et al. projected in 2019 that Brazil might need an additional 12.9 million hectares of cropland to meet Chinese demand. The observed expansion reported by the new study—close to 12 million hectares during 2019–2024—is strikingly close to that projection.
The paper does not claim to have quantitatively attributed the expansion to these drivers. Its interpretation is more limited: existing research and temporal correspondence suggest that global market disruption, US tariff policy, and changing soybean prices may together have contributed to the acceleration of Brazilian cropland expansion.
05 · Cropland loss under war and drought
The paper also discusses several cases in which conflict or climate stress is associated with cropland contraction.
Ukraine. Conflict began in 2014 and escalated dramatically in 2022. The study estimates that about 0.25 million hectares of cropland were abandoned in Russian-occupied areas. Because the mapping uses four-year composites, immediate abandonment caused by conflict may be underestimated. The estimate therefore captures land that had become fully abandoned or showed a clear abandonment trajectory, not the total area of cropland affected by war.
Azerbaijan / Nagorno-Karabakh. Roughly 61,000 hectares of cropland were abandoned in the conflict area during 2015–2024, equivalent to 34% of its 2015 cropland area.
Nigeria. Conflict associated with Boko Haram and population displacement was linked to the abandonment of about 314,000 hectares of cropland in Borno State, or 20% of its 2015 cropland area. Neighboring regions may have experienced expansion as displaced populations resettled.
Morocco. Cropland declined by a net 0.38 million hectares during 2015–2024. The paper considers prolonged severe drought a likely contributor and cites external reports indicating that wheat-planted area and production in 2024 were about 50% lower.
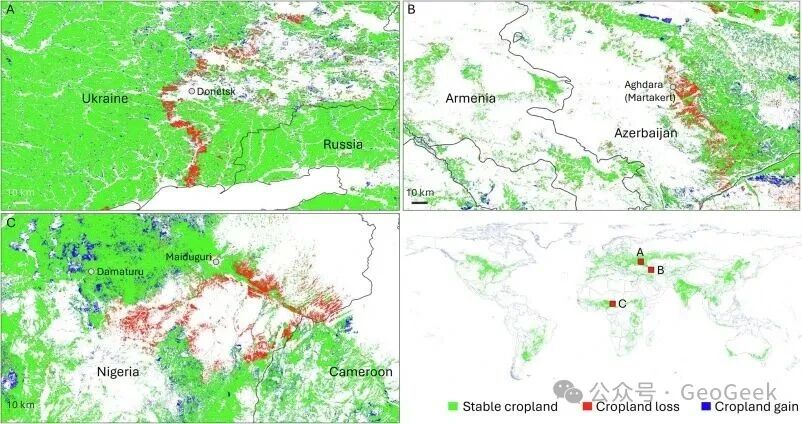
Figure 3 · Examples of cropland change associated with armed conflict in Ukraine (A), Azerbaijan (B), and Nigeria (C).